Submitted by Norm Roulet on Thu, 04/29/2010 - 10:38.

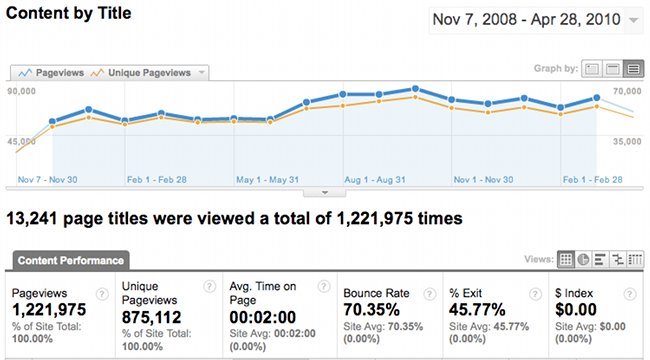
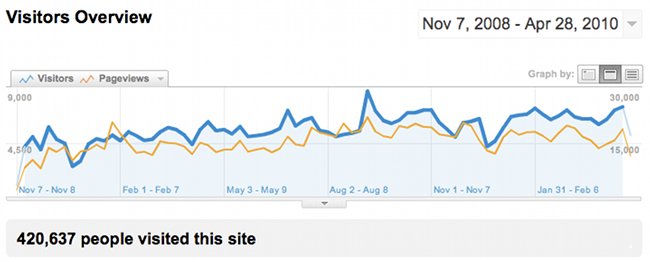
I've been asked what our traffic looks like over time, so I pulled a few quick charts of the number of visitors to realneo since we started using Google Analytics, and what they have visited, to measure performance of this site - and we've grown by pretty much all counts I've considered important by 30-100% since then - in some cases by 1,000s% - in less than a year-and-a-half.
There have been peaks around elections - largely due to Trolls - and valleys around Thanksgiving and Christmas, when many of our work and school traffic is on vacation, but we have generally seen very linear and healthy growth throughout all this time (and leading to that, I'm sure - other than when attacked by trolls, we're a pretty direct place).
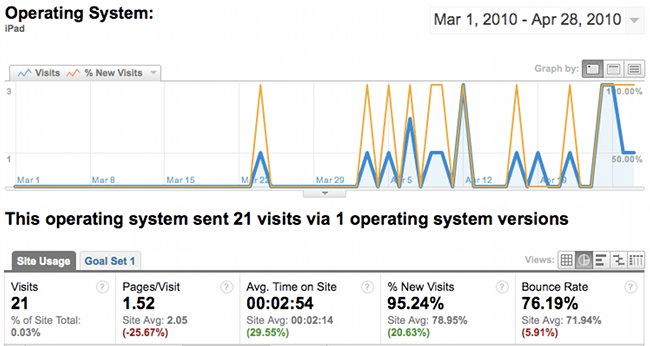
I'll be posting more analyses of growth of traffic by operating system and technology as that is where we see the most transition and dynamism on the Internet, and realNEO statistics are an excellent barometer of what is happening in the overall global technology world... like how the iPad is doing, so far... and how it happened to show up in realNEO stats the week before it was available to the public (hi Apple developers)...

realNEO members should feel free to post here or email norm [at] realneo [dot] us to request any specific analyses of our statistics they would like - I'll be glad to run them if they are possible - for now, hopefully the charts here offer a useful overview of realNEO today, and offer some vision into our future...
